128 UK Home Heating Statistics (November 2026)
Gas heats about three in four homes in England, and in Leeds and Bradford the share is higher still. This page collects the published figures on how UK homes are heated, what that costs, how efficient the homes and boilers are, how fast heat pumps are arriving, who cannot afford to keep warm, how safe gas is and how much carbon heating emits. Every figure links to the body that published it and carries the month of publication. Where a source gives a figure for Leeds, Bradford or Yorkshire and the Humber, we show it beside the national one.
BASI Heating installs and services boilers, heat pumps and air conditioning across Bradford, Leeds and West Yorkshire. We check each figure against its source every month and change the count in the heading when figures are added or retired.
Key Takeaways
- The share of English dwellings using fixed room heaters as their main heating fell from 12% in 1996 to 4% in 2024 (MHCLG, Jan 2026).
- In rural England 32% of households used a solid fuel or oil heating system in 2023-24, against 0.7% in urban areas (MHCLG, May 2025).
- Ofgem’s typical household gas use was cut to 9,500 kWh, and under the old 2023 basis the October 2026 cap would have been £1,935 rather than £1,723 (Ofgem, Aug 2026).
- In England, 96.1% of new dwellings with an EPC are rated band C or above, against 47.2% of existing ones (MHCLG, Oct 2026).
- Bradford’s existing homes are the weakest of the four areas charted, with 39.2% rated band C or above, against 47.2% across England (MHCLG, Oct 2026).
- Fuel poverty in English social housing fell from 23.4% in 2017 to 12.0% in 2025 as 80.0% of social homes reached energy band C or better (DESNZ, Aug 2026).
- An estimated 7.63 million English households (30.4%) would need to spend more than 10% of income after housing costs on energy in 2025, down from 8.55 million (34.4%) in 2024 (DESNZ, Aug 2026).
- Nesta estimates that households in Great Britain have spent up to £8 million on planning applications and sound tests for heat pumps (Nesta, Sep 2026).
- Nearly 98% of Boiler Upgrade Scheme grants paid have gone to air-to-water heat pumps (94,545 of 96,611) (DESNZ, Oct 2026).
- Heating appliances were the source of ignition in 903 accidental dwelling fires in England in 2025/26, half the 1,801 in 2010/11 (our calculation: space heating plus central and water heating) (MHCLG, Aug 2026).
- Residential emissions rose 4% in 2024 because households used more gas as cost pressures eased, showing how quickly price and weather can undo progress (DESNZ, Feb 2026).
- In 2024, 68% of domestic emissions in UK local authority areas arose from gas use, 20% from electricity and 12% from other fuels (DESNZ, Jun 2026).
How are UK homes heated?
Gas still heats most homes, and Leeds and Bradford lean on it slightly more than England does. The headline share depends on who is counting: the Census counts households whose central heating runs on mains gas only, the English Housing Survey counts homes whose main system is gas-fired, and DESNZ counts properties with a gas meter. These are three different measures, so they give three different answers.
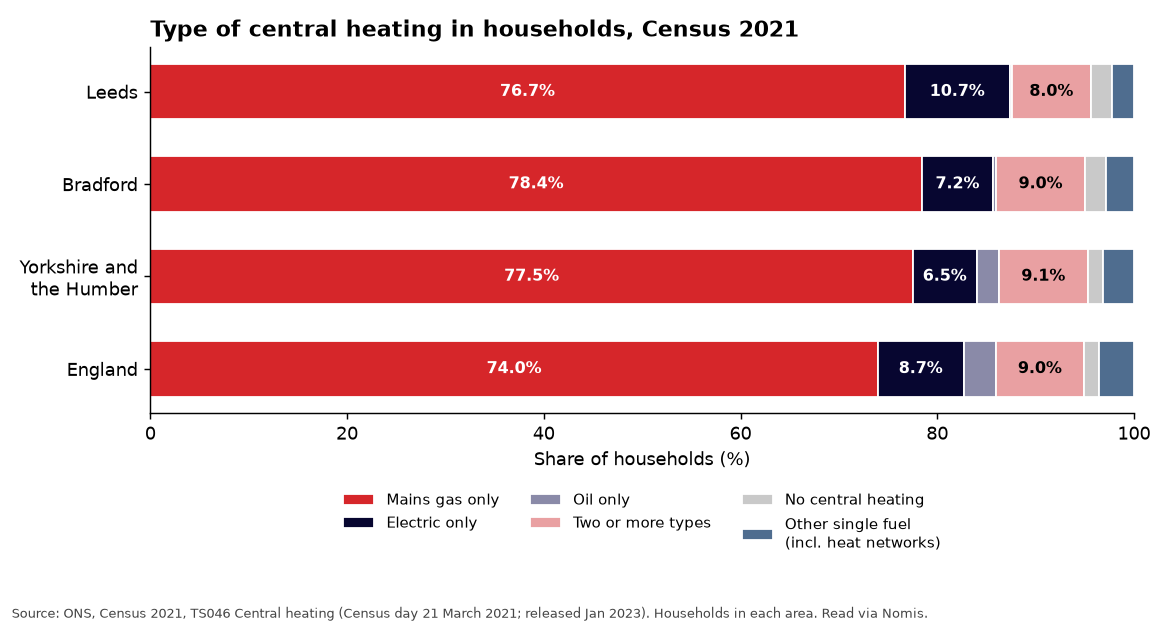
Figure 1: Mains gas is the only central heating fuel in roughly three quarters of homes in every area shown, with Leeds the most electric. Source: ONS, Census 2021 TS046 Central heating, Mar 2021. Chart drawn from the source’s data (counts read through Nomis, percentages our calculation), captured 12 Nov 2026.
What share of homes use mains gas for central heating?
Census day was 21 March 2021, so these are the latest local counts until 2031. Percentages are our calculation from the published household counts.
- Across England, 17,334,040 of 23,436,085 households (74.0%) had mains gas as their only central heating fuel (ONS, Jan 2023).
- In Leeds, 261,846 of 341,468 households (76.7%) had mains gas only central heating (ONS, Jan 2023).
- In Bradford, 164,616 of 209,866 households (78.4%) had mains gas only central heating (ONS, Jan 2023).
- Across Yorkshire and The Humber, 1,806,896 of 2,330,658 households (77.5%) had mains gas only central heating (ONS, Jan 2023).
- In Leeds, 36,550 households (10.7%) used electric only central heating, our calculation from the Census count (ONS, Jan 2023).
- In England, 351,635 households (1.5%) had no central heating, our calculation from the Census count (ONS, Jan 2023).
How many homes are off the gas grid?
DESNZ estimates this by subtracting domestic gas meters from the number of properties, so it is a modelled figure for 2024, not a count.
- In England, an estimated 3,977,000 properties (15.6%) had no gas meter in 2024 (DESNZ, Dec 2025).
- In Leeds, an estimated 51,600 properties (13.8%) had no gas meter in 2024, up from 11.2% in 2015 (DESNZ, Dec 2025).
- In Bradford, an estimated 16,700 properties (7.5%) had no gas meter in 2024 (DESNZ, Dec 2025).
What do English homes use for main heating?
The English Housing Survey is a sample survey of England only, so its figures carry a margin of error.
- 93% of English dwellings had central heating in 2024, up from 80% in 1996 (MHCLG, Jan 2026).
- Only 85% of private rented dwellings had central heating in 2024, against 95% of owner occupied homes (MHCLG, Jan 2026).
- Around 21.2 million households (86%) used a gas-fired main heating system in 2023-24 (MHCLG, May 2025).
- 608,000 households (2%) were heated by a communal system in 2023-24 (MHCLG, May 2025).
- 276,000 dwellings (1%) used a heat pump as their primary space heating in 2023 (MHCLG, May 2025).
What kind of boiler do English homes have, and how old is it?
Boiler types are counted across all dwellings, including homes with no boiler at all.
- 63% of dwellings had a condensing-combination boiler in 2024 (MHCLG, Jan 2026).
- About 1.26 million dwellings (4.9%) still had a standard boiler in 2024 (MHCLG, Jan 2026).
- 6.4 million households (26%) lived in homes whose primary heating system was more than 12 years old in 2023-24 (MHCLG, May 2025).
How much energy and money does heating a home use?
Homes in Leeds and Bradford burn more gas than the national average, and most of what any home uses goes on warmth, so a move in the gas price reaches the bill fast.
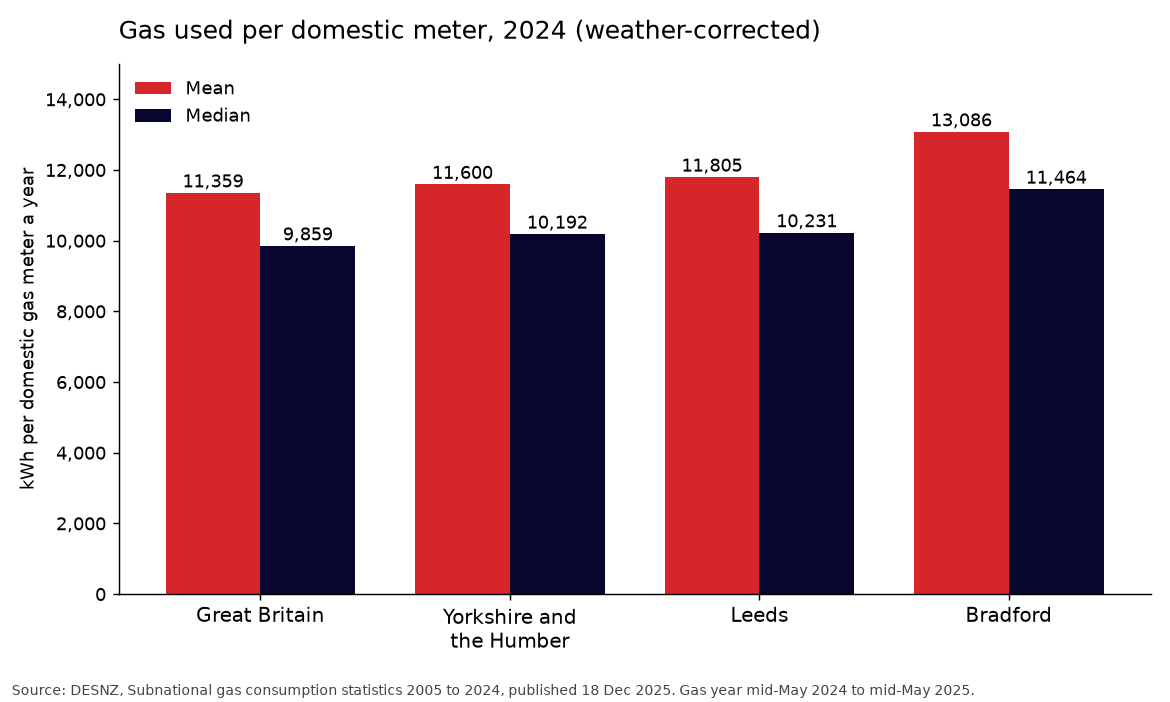
Figure 2: Gas used per domestic meter a year, weather-corrected, mean and median. Bradford sits furthest above the Great Britain figure. Source: DESNZ, Subnational gas consumption statistics 2005 to 2024, gas year mid-May 2024 to mid-May 2025. Chart drawn from the source’s data, captured 12 Nov 2026.
How much gas does a home in Leeds or Bradford use?
Bradford homes use the most gas of the four areas compared here. All figures are kWh per domestic gas meter, weather-corrected, for the gas year mid-May 2024 to mid-May 2025.
- Across Great Britain the mean domestic meter used 11,359 kWh and the median used 9,859 kWh (DESNZ, Dec 2025).
- In Yorkshire and the Humber the mean domestic meter used 11,600 kWh and the median used 10,192 kWh (DESNZ, Dec 2025).
- In Leeds the mean domestic meter used 11,805 kWh and the median used 10,231 kWh (DESNZ, Dec 2025).
- In Bradford the mean domestic meter used 13,086 kWh and the median used 11,464 kWh (DESNZ, Dec 2025).
How much of a home’s energy goes on heating?
Space and water heating take most of the energy a UK home uses. This measures energy, not money: no body publishes a share of the bill that is heating.
- Space heating took 60.8% of the energy used in UK homes in 2025 (DESNZ, Sep 2026).
- Water heating took a further 17.4% of the energy used in UK homes in 2025 (DESNZ, Sep 2026).
What does the energy price cap say about gas and electricity prices?
Gas is far cheaper per unit than electricity, which is why the cap moves with the gas market. Cap figures are Great Britain averages for Direct Debit customers.
- The cap for a typical dual fuel household rose 4% on 1 October 2026, from £1,663 to £1,723 a year (Ofgem, Aug 2026).
- Ofgem’s typical household now uses 2,500 kWh of electricity and 9,500 kWh of gas a year (Ofgem, Aug 2026).
- Ofgem cut those typical values because homes use about 17% less gas and 7% less electricity than at the last review (Ofgem, Aug 2026).
- From October to December 2026 the gas cap is 7.97p per kWh plus a standing charge of 29.68p a day (Ofgem, Aug 2026).
- Over the same period the electricity cap is 26.32p per kWh plus a standing charge of 54.83p a day (Ofgem, Aug 2026).
- Electricity costs about 3.3 times as much per kWh as gas under the cap, our calculation from 26.32p and 7.97p (Ofgem, Aug 2026).
- Average actual UK dual fuel bills for calendar 2025 were £1,904, measured on higher fixed usage of 3,400 kWh of electricity and 11,200 kWh of gas, so not comparable with the cap (DESNZ, Mar 2026).
What do households spend and owe on energy?
The spending data below predate the 2026 price rises, while the debt data run to mid-2026.
- UK households spent an average of £35.90 a week on electricity, gas and other fuels in the year to March 2025 (ONS, Jun 2026).
- Households in Yorkshire and the Humber spent £16.80 a week on gas against £15.60 for the UK, as three-year averages for the years to March 2023 to 2025 (ONS, Jun 2026).
- Domestic energy debt and arrears in Great Britain reached £5.02bn in Q2 2026 (Ofgem, Oct 2026).
- The average gas arrears balance for customers with no repayment arrangement was £1,613 in Q2 2026, up 8% on a year earlier (Ofgem, Nov 2026).
How efficient are UK homes and their boilers?
Most homes are less efficient than the headline averages suggest, because new builds lift the figures while older stock lags. The gap is wider in Bradford than in Leeds, and condensing boilers have spread much faster than insulation.
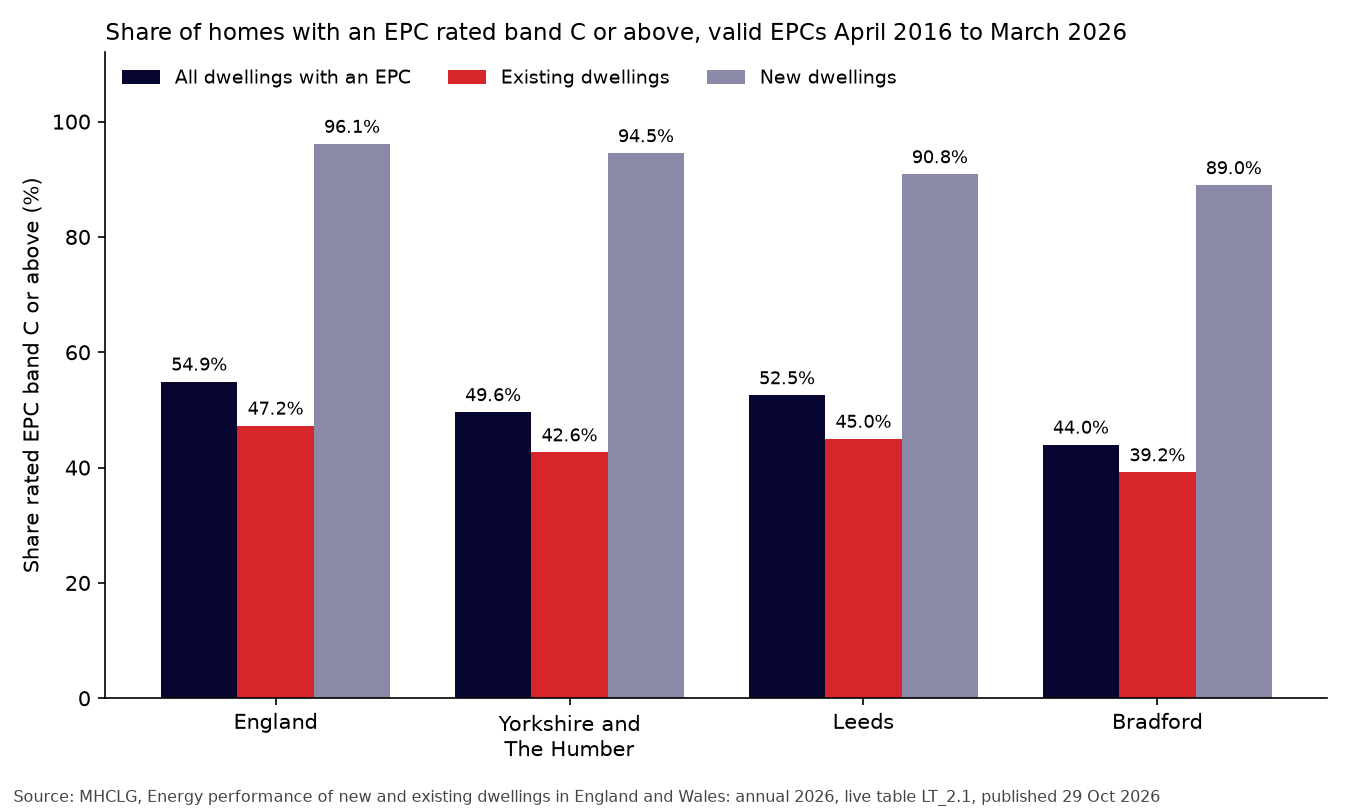
Figure 3: Share of dwellings rated EPC band C or above, by area. New homes pass almost without exception, while existing homes in Bradford fall well short of the national figure. Source: MHCLG, Energy performance of new and existing dwellings in England and Wales: annual 2026 (live table LT_2.1), Mar 2026. Chart drawn from the source’s data, captured 12 Nov 2026.
How many homes are rated band C or above?
About half of the homes that hold an energy performance certificate, with Leeds close to the national figure and Bradford well below it. Certificates exist only for homes built, sold or let, so they do not cover every home. ONS ended its own series in April 2026 and MHCLG now publishes the successor.
- Of dwellings in England with a valid energy performance certificate (EPC) lodged between April 2016 and March 2026, 54.9% were rated band C or above (MHCLG, Oct 2026).
- In Leeds, 52.5% of dwellings with a valid EPC were rated band C or above over the same period (MHCLG, Oct 2026).
- In Bradford, 44.0% of dwellings with a valid EPC were rated band C or above over the same period (MHCLG, Oct 2026).
- Yorkshire and The Humber had the lowest regional median EPC rating in England at 68, against 69 for England as a whole (MHCLG, Oct 2026).
- The English Housing Survey, which inspects a sample of all homes rather than only certified ones, put 56% of English dwellings in energy efficiency bands A to C in 2024, up from 26% in 2014 (MHCLG, Jan 2026).
- ONS found 207 of 318 local authority areas in England and Wales had more than half of their dwellings with an EPC in band C or higher, using records to March 2025 (ONS, Oct 2025).
- MHCLG counted 238 of 318 local authority areas on the same test using records to March 2026, though its method differs from ONS (no Valuation Office de-duplication), so the rise is not a like-for-like change (MHCLG, Oct 2026).
Do new homes and older homes differ much?
Yes. Certificates show new homes far ahead of existing ones, and the survey average has risen steadily since the 1990s.
- The median EPC rating for new dwellings in England was 84 (band B), against 68 for existing dwellings, for certificates lodged April 2016 to March 2026 (MHCLG, Oct 2026).
- The median EPC score for new dwellings in England rose from 82 in the five years to March 2013 to 84 in the five years to March 2025 (ONS, Oct 2025).
- The mean SAP rating of English dwellings was 68 points in 2024, up from 45 points in 1996 (MHCLG, Jan 2026).
- Bringing English homes built before 1919 up to band C would cost £10,728 on average, against £7,480 across all dwellings that could be improved, in 2024 (MHCLG, Jan 2026).
How well insulated are homes?
Most cavity walls are filled, but solid-wall homes are largely uninsulated and private rented homes trail owner-occupied ones. Bradford has had far more insulation work under government schemes than Leeds.
- At the end of December 2025, 71% of the 21.8 million homes in Great Britain with cavity walls had cavity wall insulation (DESNZ, Mar 2026).
- At the end of December 2025, 11% of the 8.5 million homes in Great Britain with solid walls had solid wall insulation (DESNZ, Mar 2026).
- In England in 2024, 60% of private rented dwellings with cavity walls were insulated, against 73% of owner occupied ones (MHCLG, Jan 2026).
- Between January 2013 and December 2025, Bradford had 235.4 households per 1,000 receiving Energy Company Obligation measures, against 122.3 in Leeds and 86.5 across England (DESNZ, Mar 2026).
How modern are boilers and meters?
Condensing combination boilers are now the most common type and about a quarter of households have a heating system more than 12 years old (both figures are in the first section). Smart meter coverage depends on which count you use.
- At the end of June 2026, 75% of domestic properties in Great Britain had a smart electricity meter, counting both smart and traditional mode (DESNZ, Aug 2026).
How many households cannot afford to heat their home?
Fewer English households are fuel poor than a year ago, but the fall is small, uneven and partly a projection. Leeds and Bradford both sit above the national rate, and Bradford has the higher share of the two.
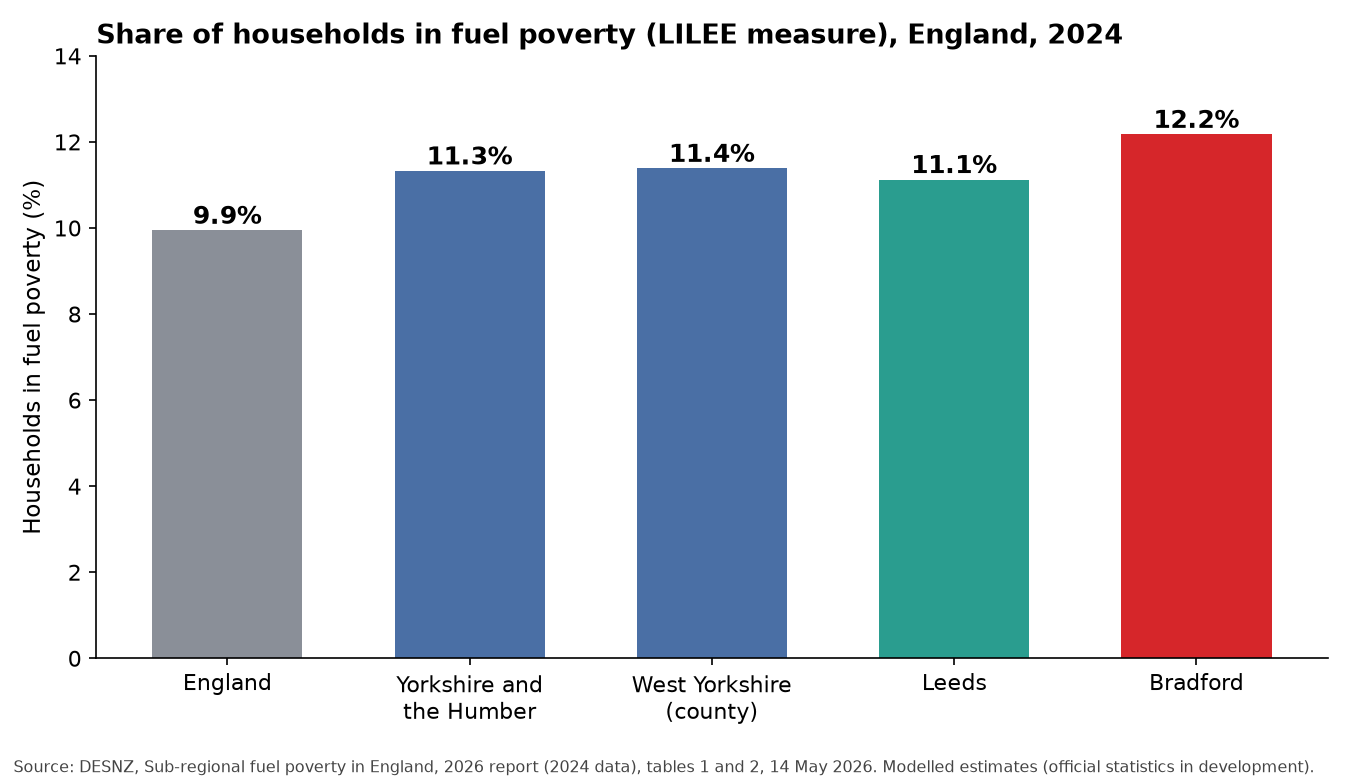
Figure 4: Fuel poverty rate in 2024 for England, Yorkshire and the Humber, West Yorkshire, Leeds and Bradford. Local figures are modelled estimates and the 2024 data year is the latest available at local level. Source: DESNZ, Sub-regional fuel poverty in England, 2026 report (2024 data), tables 1 and 2, 2024 data. Chart drawn from the source’s data, captured 12 Nov 2026.
How many households in England are in fuel poverty?
Fuel poverty here means the Low Income Low Energy Efficiency (LILEE) measure: a household in an energy rating of band D or below whose income after housing and energy costs falls under the poverty line. The 2025 figures are projections, and the report was republished in August 2026 to correct a benefit-receipt calculation error.
- An estimated 9.4% of English households (2.36 million) were in fuel poverty in 2025 (a projection), down from 9.9% (2.47 million) in the final 2024 estimate (DESNZ, Aug 2026).
- The average fuel poverty gap, the cut in fuel costs a fuel poor household would need to leave fuel poverty, was £379 in England in 2025 (DESNZ, Aug 2026).
- Private renters had the highest fuel poverty rate of any tenure in England in 2025, at 17.2% of households (DESNZ, Aug 2026).
How does fuel poverty in Leeds and Bradford compare?
Local data lags the national release by a year. The latest local estimates are for 2024, and DESNZ says they should only be used to spot general patterns.
- Yorkshire and the Humber had the second highest regional fuel poverty rate in England in 2024, at 11.3% of households (DESNZ, May 2026).
- In Bradford 26,829 households (12.2%) were in fuel poverty in 2024 (DESNZ, May 2026).
- In Leeds 39,913 households (11.1%) were in fuel poverty in 2024 (DESNZ, May 2026).
- In 2025/26, 28.3% of Bradford households received a Warm Home Discount Core Group rebate, against 20.8% in Leeds and 19.9% across England (DESNZ, Jun 2026).
Is England on track to end fuel poverty?
Not on current delivery, according to the government’s independent adviser. The 2030 target is for fuel poor homes to reach energy rating band C.
- Of low income households, 65.2% lived in a band C or better home in 2025, a projection, up from 62.6% in 2024 (DESNZ, Aug 2026).
- The Warm Home Discount paid its £150 Core Group rebate to 5.52 million households in Great Britain in 2025/26, after the scheme was widened (DESNZ, Jun 2026).
- The government’s Fuel Poverty Strategy adds a goal of lifting 1 million households out of fuel poverty by 2030, which the Committee on Fuel Poverty notes would not end fuel poverty for all 2.36 million fuel poor households (Committee on Fuel Poverty, Sep 2026).
- The Committee estimates that upgrading about 2.4 million homes by the end of 2030 would mean completing roughly 35,000 homes every month (Committee on Fuel Poverty, Sep 2026).
What do cold homes do to health?
Cold-associated deaths are modelled estimates, not counted deaths, and UKHSA has already had to correct one winter’s figure. England’s housing survey shows how many homes carry the problems.
- UKHSA estimated 2,200 cold-associated deaths in England in winter 2025 to 2026, with a 95% confidence interval of 1,627 to 2,759 (UKHSA, Oct 2026).
- UKHSA corrected its winter 2024 to 2025 estimate from 2,544 to 2,788 cold-associated deaths after finding a mis-dated cold episode (UKHSA, Oct 2026).
- About 1.4 million English dwellings (5%) had a problem with damp in 2024, up on the 4% modelled for 2021 and 2022 (MHCLG, Jan 2026).
- Damp affected 10% of private rented dwellings in England in 2024, against 4% of owner occupied and 7% of social rented homes (MHCLG, Jan 2026).
- Excess cold was among the most common Category 1 hazards in English homes in 2024, found in 2% of dwellings (MHCLG, Jan 2026).
How fast are heat pumps replacing boilers?
Heat pumps are growing from a small base, but retrofit installations fell in 2026 and sit well short of the government’s target. The Boiler Upgrade Scheme is now the main route in, and Leeds and Bradford both have hundreds of homes on it.
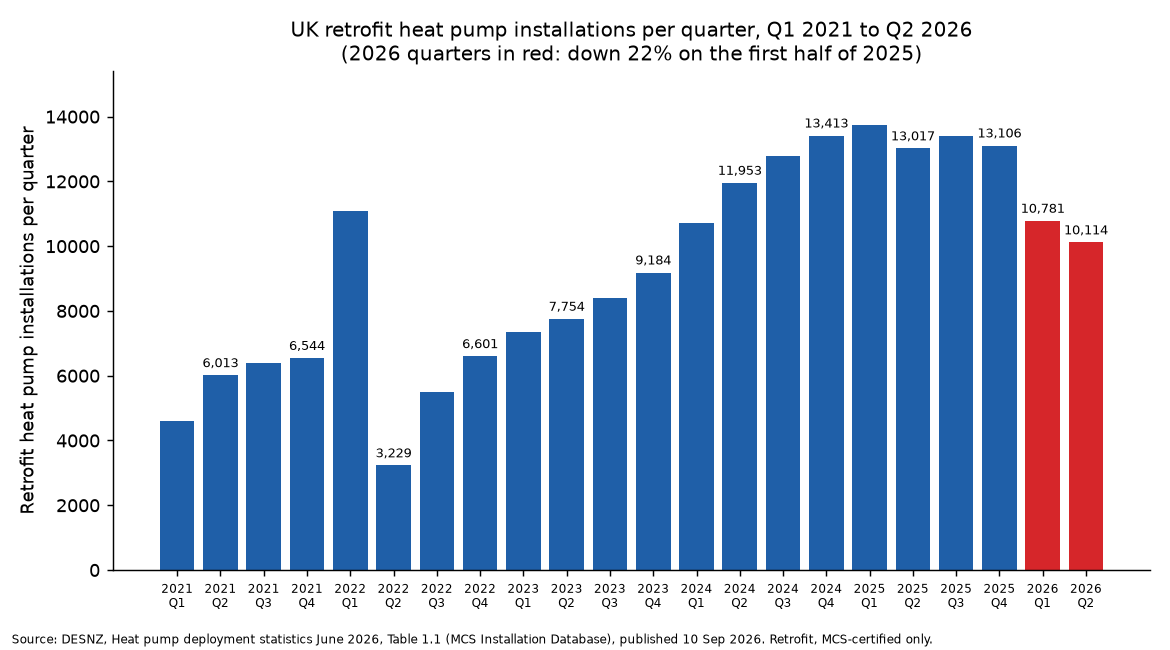
Figure 5: Retrofit heat pump installations per quarter in the UK, with the two 2026 quarters in red. The spike in Q1 2022 came as the Domestic Renewable Heat Incentive closed, just before the Boiler Upgrade Scheme opened. Source: DESNZ, Heat pump deployment statistics June 2026, Jun 2026. Chart drawn from the source’s data, captured 12 Nov 2026.
How many heat pumps are being installed?
Counts differ because the bodies measure different things. DESNZ counts retrofit installations certified under MCS and leaves out new builds. The Heat Pump Association counts units leaving factories, including hot water heat pumps and new-build units, so its total is higher.
- UK retrofit installations in the first half of 2026 were 20,895, a 22% fall on the 26,768 in the same months of 2025 (DESNZ, Sep 2026).
- UK retrofit installations in 2025 were 9% higher than the 48,857 installed in 2024 (DESNZ, Sep 2026).
- The Climate Change Committee puts retrofit installations at around 52,000 in 2025, up 7% on 2024 and well below the 56% growth of the year before (Climate Change Committee, Jun 2026).
- Heat Pump Association factory-gate sales reached 125,037 units in 2025, up 27% on 2024 (Heat Pump Association, Mar 2026).
- The Heat Pump Association says sales would need 33% compound growth every year to reach 450,000 installations a year by 2030 (Heat Pump Association, Mar 2026).
- 25% of all new homes were built with a heat pump in 2025 (Climate Change Committee, Jun 2026).
How is the Boiler Upgrade Scheme doing, and what about Leeds and Bradford?
Redemptions are rising, and September 2026 was the scheme’s best month for grants paid. These figures are for England and Wales to the end of September 2026.
- 96,611 grants have been redeemed and paid since the scheme opened in May 2022 (DESNZ, Oct 2026).
- Leeds has had 889 heat pump redemptions paid (DESNZ, Oct 2026).
- Bradford has had 623 heat pump redemptions paid (DESNZ, Oct 2026).
- Yorkshire and the Humber has had 8,896 redemptions paid across all technologies (DESNZ, Oct 2026).
- The median installed cost of an air-to-water heat pump in July to September 2026 was £12,826, including the grant (DESNZ, Oct 2026).
Is the UK on track against its targets and Europe?
No. The 2021 market-capacity target has been replaced by a later and lower installation target, and the UK sells far fewer heat pumps per home than the leading European markets.
- The 2021 Heat and Buildings Strategy committed to a minimum market capacity of 600,000 heat pump installations a year by 2028 (National Audit Office, Mar 2024).
- The Warm Homes Plan aims for 450,000 installations a year by 2030, of which around 250,000 are expected to be retrofit (Climate Change Committee, Jun 2026).
- The UK sold around 3.5 heat pumps per 1,000 households in 2024, 14 times fewer than Norway (EHPA, Jul 2025).
Do heat pumps work, and do people want one?
Measured performance is good and awareness is high, but reluctance among owner-occupiers remains. The performance figures below come from an interim analysis of a government-funded trial of 742 installations.
- The median seasonal performance factor of air source heat pumps in the trial was 2.80, from 291 systems (Energy Systems Catapult, Mar 2023).
- On the coldest day of the monitoring period the median efficiency was 2.44 (Energy Systems Catapult, Mar 2023).
- 78% of UK adults had heard of air source heat pumps in summer 2026, and 27% said they knew a fair amount or a lot about them (DESNZ, Oct 2026).
- 25% of owner-occupiers said they were very or fairly likely to install an air source heat pump, or already had one (DESNZ, Oct 2026).
- Over 80% of the heat pump planning applications Nesta analysed across 260 Great Britain council websites were approved (Nesta, Sep 2026).
How safe is gas heating?
Gas heating is far safer than it was in the 1980s, but injuries and deaths still happen every year. Most reported harm comes from carbon monoxide, which is why flue faults, servicing and alarms matter more than fire risk.
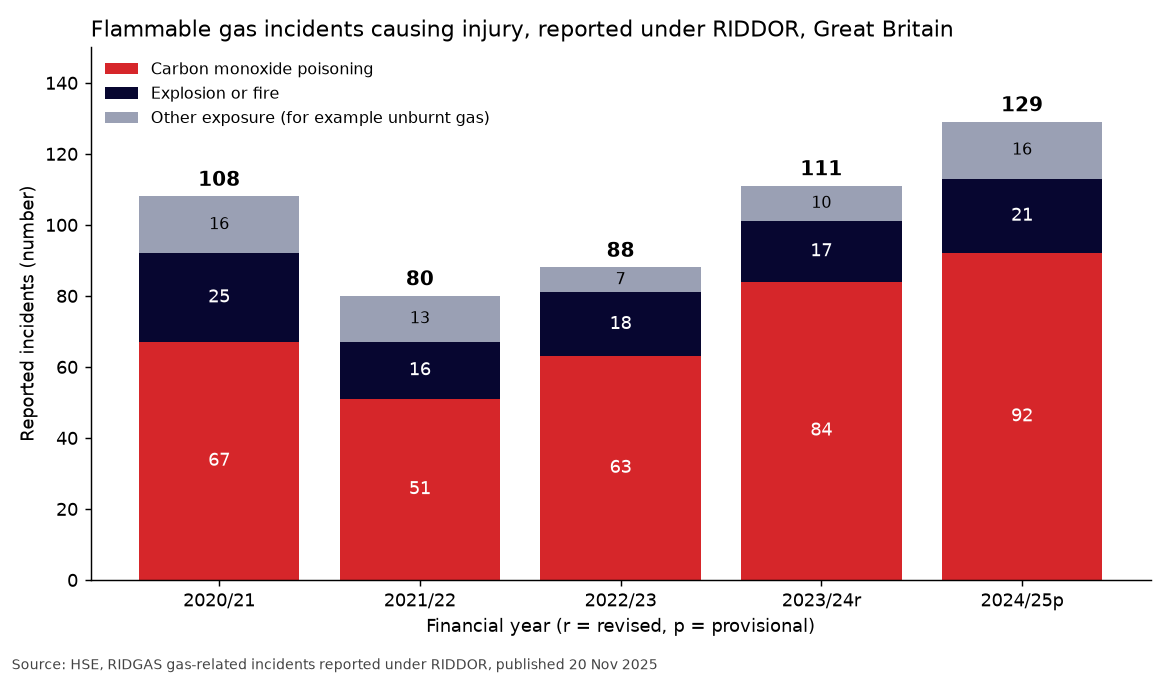
Figure 6: Flammable gas incidents causing injury, reported under RIDDOR in Great Britain, split by carbon monoxide poisoning, explosion or fire and other exposure. Carbon monoxide is the largest share every year. Source: HSE, RIDGAS gas-related incidents reported under RIDDOR, 2020/21 to 2024/25 (2024/25 provisional). Chart drawn from the source’s data, captured 12 Nov 2026.
How many gas incidents are reported each year?
HSE counts gas incidents that cause injury and are reported to it under RIDDOR. The latest year is provisional and covers Great Britain.
- There were 129 reported flammable gas incidents causing injury in Great Britain in 2024/25 (provisional), up from 80 in 2021/22 (HSE, Nov 2025).
- Of those incidents, 92 involved carbon monoxide poisoning and 21 involved explosion or fire (HSE, Nov 2025).
- Gas incidents caused 2 deaths in Great Britain in 2024/25 (provisional), one from carbon monoxide and one from explosion or fire, compared with 5 in each of the three years before (HSE, Nov 2025).
- Gas incidents caused 169 non-fatal injuries in 2024/25 (provisional), of which 133 were carbon monoxide poisoning (HSE, Nov 2025).
How many people die from carbon monoxide?
The ONS counts deaths registered in England and Wales. Its figures cover all fuels and sources, not only gas boilers, and the report below reproduces the ONS table.
- Around 25 deaths a year in England and Wales were from accidental carbon monoxide poisoning of the kind coded X47 with T58 (toxic effect of carbon monoxide), as a five-year average for 2020 to 2024, in the HSE cross-government report using ONS data (HSE, Apr 2026).
- A wider ONS count, reproduced in the same report, of all accidental carbon monoxide poisonings, selected by ICD-10 underlying cause V01-X59 with T58 as secondary cause, was 60 deaths registered in England and Wales in 2024, against 77 in 2023 (HSE, Apr 2026).
- Of the 24 ONS deaths in the narrower X47 group in 2024, 15 occurred at home (HSE, Apr 2026).
- 62% of dwellings in England had a carbon monoxide alarm in 2024, from the English Housing Survey as reported in the HSE cross-government report (HSE, Apr 2026).
What faults do gas engineers report?
Registered engineers must notify HSE of appliances and fittings they judge dangerous. These are faults found, not incidents.
- Engineers notified HSE of 2,010 dangerous gas fittings in Great Britain in 2024/25 (provisional), down from 2,413 in 2020/21 (HSE, Nov 2025).
- Boilers accounted for 320 of the 385 notifications for an inadequate flue in 2024/25 (provisional) (HSE, Nov 2025).
- Rented homes produced 703 notifications in 2024/25 (provisional), against 1,307 in owner-occupied homes (HSE, Nov 2025).
What do enforcement and fire figures show?
HSE enforces the Gas Safety (Installation and Use) Regulations 1998. Fire figures count accidental dwelling fires attended by fire and rescue services in England.
- HSE issued 71 enforcement notices under the Gas Safety (Installation and Use) Regulations 1998 in the year to 31 March 2025, of which 50 were prohibition notices and 21 were improvement notices (HSE, Apr 2026).
- HSE brought 11 gas safety charges in 2024/25, resulting in 10 convictions (HSE, Apr 2026).
- Space heating appliances were the source of ignition in 747 accidental dwelling fires in England in 2025/26, down from 1,391 in 2010/11 (MHCLG, Aug 2026).
- Central and water heating appliances were the source of ignition in 156 accidental dwelling fires in England in 2025/26, down from 410 in 2010/11 (MHCLG, Aug 2026).
How much carbon does home heating emit?
Emissions from UK homes are falling, but mild weather and high prices have driven much of the recent fall, not a change of heating system. Gas is still the main fuel, and the cuts the Climate Change Committee calls for are far larger than anything yet achieved.
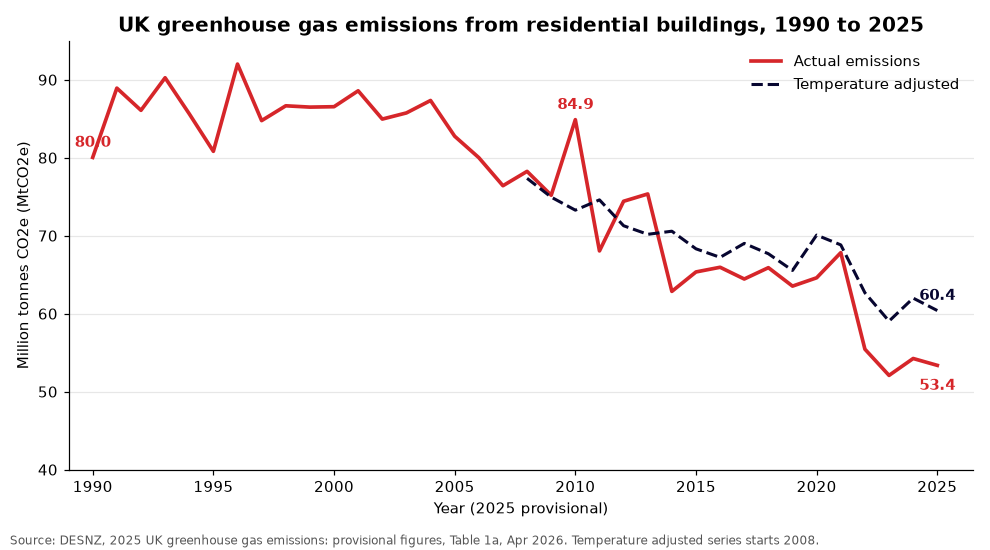
Figure 7: UK residential building emissions, actual and temperature adjusted, 1990 to 2025. The gap between the lines shows how far recent mild weather has flattered the trend. Source: DESNZ, 2025 UK greenhouse gas emissions: provisional figures, Dec 2025 data (provisional). Chart drawn from the source’s data (Table 1a), captured 12 Nov 2026.
How much do UK homes emit?
Most residential emissions come from burning gas for heating and cooking, and the total swings with the weather.
- UK residential buildings emitted 53.4 million tonnes of carbon dioxide equivalent (MtCO2e) in 2025, a 2% fall on 2024; the figure is provisional (DESNZ, Apr 2026).
- Residential building emissions in 2025 were 33% below their 1990 level (DESNZ, Apr 2026).
- The buildings and product uses sector produced 22% of UK greenhouse gas emissions in 2025, and 66% of that sector’s emissions came from fuel burned in residential buildings (DESNZ, Apr 2026).
- Temperatures in 2025 were 0.9 degrees Celsius above the 30-year mean; on a temperature-adjusted basis residential emissions were 60.4 MtCO2e, about 7 MtCO2e above the recorded figure (our calculation from the actual and temperature-adjusted rows of Table 1a) (DESNZ, Apr 2026).
- The National Audit Office found that heating the UK’s 28 million homes accounted for 18% of all UK greenhouse gas emissions in 2021, a different year and source from the DESNZ figures above (National Audit Office, Mar 2024).
How do Leeds and Bradford compare, and how carbon-intensive is gas?
Per head, homes in both cities emit slightly less than the UK average, and a kilowatt hour of grid electricity now carries less carbon than a kilowatt hour of gas.
- In 2024 domestic emissions (gas, electricity and other fuels used at home) were 1.07 tonnes CO2e per resident in Leeds, 1.10 in Bradford, 1.16 in Yorkshire and the Humber and 1.13 across the UK (our calculation from the local authority emissions dataset and its mid-year population figures) (DESNZ, Jun 2026).
- The 2026 UK conversion factors give 0.182 kg CO2e per kilowatt hour of natural gas (gross calorific value) and 0.131 kg for UK grid electricity, so electricity is about 28% lower per kWh (our calculation; the electricity factor covers generation only) (DESNZ, Jun 2026).
- Great Britain’s electricity averaged 125 grams of CO2 per kilowatt hour in 2024, the lowest year on record at the time (National Grid ESO, Jan 2025).
- Zero-carbon sources supplied an average of 63% of Great Britain’s electricity in 2025 (National Grid ESO, Jan 2026).
What does the Climate Change Committee say must change?
The Climate Change Committee says heating emissions will only fall quickly once homes switch fuel, and that today’s installations are too few to show up in the totals.
- The Committee’s progress report found buildings emissions fell 1.2 MtCO2e in 2025, with residential buildings down 1.6%, despite a colder winter than 2024 (Climate Change Committee, Jun 2026).
- Buildings emissions in 2025 were 28% below their 2008 level (Climate Change Committee, Jun 2026).
- Heat pump retrofits delivered only around 0.1 MtCO2e of additional emissions savings in 2025 (Climate Change Committee, Jun 2026).
- Fewer than 2% of UK homes are heated with a heat pump, which the Committee describes as among the lowest shares in Europe (Climate Change Committee, Jun 2026).
- In its Seventh Carbon Budget advice the Committee puts residential buildings at 52.2 MtCO2e in 2023, 12% of UK emissions, and says they must fall 66% by 2040 to 17.7 MtCO2e (Climate Change Committee, Feb 2025).
- The same advice has 52% of existing UK homes heated by a heat pump by 2040, up from around 1% in 2023 (Climate Change Committee, Feb 2025).
- The National Audit Office cites the Committee’s estimate that £162 billion of additional investment is needed between 2020 and 2050 to install low-carbon heating in existing UK homes (National Audit Office, Mar 2024).
Methodology and Sources
Every statistic on this page was read on the publisher’s own page, spreadsheet or report in November 2026, and each one links to that document. We cite the body that produced the figure, not a news report about it. The month and year after each link is when the figure was published, which is often later than the period it describes, so the period is stated in the sentence.
Three rules shape what is here. Figures that measure different things are not blended: the Census, the English Housing Survey and DESNZ each count gas heating in a different way, and the page says which is which. Anything we worked out ourselves from two published numbers is marked as our calculation. Figures for Leeds, Bradford and Yorkshire and the Humber appear only where the source publishes them at that level.
The charts are drawn from the source’s own data and each caption names the table used. Survey figures carry a margin of error, and several series (fuel poverty for 2025, emissions for the latest year) are projections or provisional and will be revised.
Sources
- Department for Energy Security and Net Zero (DESNZ): subnational gas consumption, energy consumption in the UK, fuel poverty, Boiler Upgrade Scheme, heat pump deployment, household energy efficiency, smart meters, greenhouse gas emissions and the public attitudes tracker.
- Ministry of Housing, Communities and Local Government (MHCLG): English Housing Survey, energy performance certificate tables and fire statistics.
- Office for National Statistics (ONS): Census 2021 central heating, household spending and energy efficiency of housing.
- Ofgem: energy price cap and debt and arrears data.
- Health and Safety Executive (HSE): gas safety statistics reported under RIDDOR.
- Climate Change Committee: progress reports to Parliament and the Seventh Carbon Budget.
- National Audit Office, Committee on Fuel Poverty, UK Health Security Agency, Heat Pump Association, European Heat Pump Association, Energy Systems Catapult, National Grid ESO and Nesta.
Glossary
- Energy performance certificate (EPC): a rating from A to G of how much energy a home needs for heating, hot water and lighting.
- Fuel poverty: in England, a household in a home rated band D or below whose income after heating costs falls below the poverty line.
- Boiler Upgrade Scheme: the government grant towards replacing a fossil fuel boiler with a heat pump or biomass boiler in England and Wales.
- Air to water heat pump: a heat pump that takes heat from outside air and puts it into radiators, underfloor heating and a hot water cylinder.
- Seasonal performance factor: the heat a heat pump delivers over a year divided by the electricity it used.
- MCS certification: the quality scheme an installer and product must hold for a heat pump to qualify for the grant.
- Gas Safe Register: the legal register of engineers allowed to work on gas appliances in Great Britain.
- Carbon monoxide: a poisonous gas with no smell, produced when gas, oil or solid fuel burns without enough air.
- RIDDOR: the regulations under which deaths, injuries and dangerous gas fittings must be reported to the Health and Safety Executive.
- Cavity wall insulation: insulation blown into the gap between the two leaves of a cavity wall.
More heating terms are explained in the BASI Heating glossary.